
- Capital cities and regions a mixed bag, with opinion divided.
- Hobart and Canberra likely to lead falls; Sydney and Melbourne could be flat
- Brisbane and Adelaide to continue strongly; Perth to record strong growth albeit question marks remain on its sustainability.
- Exuberance in the market could happen again if the RBA cuts rates in second half of 2024.
See Also: Personal finance and wealth outlook, 2024
See Also: Economy and inflation outlook, 2024
With the benefit of hindsight, you can pull this out at the end of 2024 to see if the experts were right.
The capitals
As Domain chief of research Dr Nicola Powell told the Savings Tip Jar podcast earlier this month, once again Sydney could lead the rate of price growth, especially when it comes to houses.
Domain is forecasting Sydney house prices to climb between 7% and 9% next year.
Meanwhile, those of Brisbane and Adelaide have been tipped to rise 7% to 8%, and Perth property is expected to climb 6% to 7%.
However, Melbourne house prices are tipped to grow just 2% to 4%.
Melbourne, due to its capacity to sprawl and having subdued demand, could continue its modest growth, if it grows at all. Other smaller capital cities could experience strong growth.
Propertyology head of research Simon Pressley said there are other factors at play for Melbourne, who forecast 0 to 3% growth for the city.
"The state’s ability to support economic growth will be significantly hindered for a decade or so due to the enormous state debt, onerous taxes and an interest bill that is fast approaching $1 billion per month," Mr Pressley said.
Perth, forecast for 13 to 18% growth, could be the leading capital city, but Mr Pressley noted its lack of economic diversity as a headwind long-term for the western capital.
Generally most pessimistic about the capitals was SQM Research, with its 'Boom and Bust' report highlighting a base case for Sydney values to fall up to 4%, and Melbourne falling up to 3%.
Other capitals will be stronger, with SQM's full chart below.
However CoreLogic's view was more balanced, with tougher economic conditions to weigh on property growth through much of 2024.
"It is not uncommon for downswings to eventually cascade down to the more affordable segments at a lag. For this reason, even markets with very strong performance could see a reduction in the pace of growth through 2024," head of research Eliza Owen said.
In 2023, Hobart generally led the capitals in terms of property price falls, with North Hobart and Taroona down -13.9% and -13.8% respectively, according to CoreLogic data.
The regions
Regional hubs will be more mixed, with affordability ceilings reached in some areas and demand slows due to a normalisation of workplace expectations post-Covid.
Some others, which avoided a lot of pandemic hype, could come into the fray off lower price bases.
Proptrack data showed that Cumbalum, Ocean Shores and Mullumbimby - in the Northern Rivers NSW region that experienced boom growth through the pandemic - posted property price falls of 7.6%, 10.1% and 11.9% in 2023 respectively.
That said, their median values are still over the $1 million mark. Lismore, Ballina, and West Ballina were also in the top-10 for price falls in 2023 with medians under $1 million.
Propertyology forecasts that certain regional areas could be set for a big 2024, recording value gains of 15 to 20%.
These could include Rockhampton QLD, Hahndorf SA, Bunbury WA, central Queensland, Port Lincoln SA, Albany WA and north Queensland.
These areas largely escaped the pandemic-led hype, and are coming off lower price bases.
Read more in-depth forecasts and suburb picks:
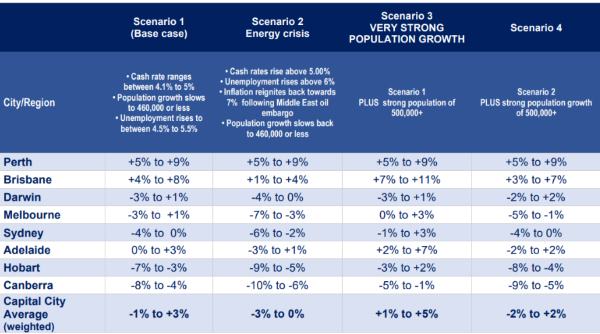
Source: SQM Research's Boom or Bust Report, four different economic scenarios.
Photo by Kat Nesterenko on Unsplash
